Modal content

একটি রাষ্ট্রায়ত্ত তফসিলী বাণিজ্যিক ব্যাংক
বেসিক ব্যাংক পিএলসি. (বাংলাদেশ স্মল ইন্ডাস্ট্রিজ অ্যান্ড কমার্স ব্যাংক পিএলসি.) তৎকালীন কোম্পানিজ অ্যাক্ট, ১৯১৩ এর অধীনে ০২ আগস্ট ১৯৮৮ তারিখে অন্তর্ভুক্ত হয়। এটি ২১ জানুয়ারি ১৯৮৯ তারিখে বাণিজ্যিক কার্যক্রম শুরু করে। ব্যাংকটি একটি তফসিলভুক্ত বাণিজ্যিক ব্যাংক, যা ব্যাংক কোম্পানি আইন ১৯৯১ দ্বারা পরিচালিত হয়। দেশের তৎকালীন নীতিনির্ধারকরা ক্ষুদ্র শিল্প (এসএসআই) খাতে অর্থায়নের জন্য বেসরকারি খাতে একটি ব্যাংকের প্রয়োজনীয়তা অনুভব করায় ব্যাংকটি প্রতিষ্ঠিত হয়। প্রতিষ্ঠাকালে ব্যাংকটি তৎকালীন বিসিসি ফাউন্ডেশনের ৭০% মালিকানা এবং বাংলাদেশ সরকারের (জিওবি) ৩০% মালিকানা নিয়ে একটি যৌথ উদ্যোগ হিসেবে গঠিত হয়। তৎকালীন বিসিসি ফাউন্ডেশন ১৯৯১ সালে ব্যাংক অব ক্রেডিট অ্যান্ড কমার্স ইন্টারন্যাশনাল (ওভারসিজ) লিমিটেড (পরবর্তীতে বিসিসিআই নামে উল্লেখিত) বন্ধ হয়ে যাওয়ার পর অকার্যকর হয়ে পড়ে। ১৯৯১ সালে বিশ্বব্যাপী বিসিসিআই বন্ধ হয়ে যাওয়ার ফলে আমানতকারীদের স্বার্থ রক্ষার উদ্দেশ্যে বাংলাদেশ সরকার ০৪ জুন ১৯৯২ তারিখের গেজেট নোটিফিকেশন দ্বারা ব্যাংকটির পূর্ণ মালিকানা গ্রহণ করে। তারপর থেকে ব্যাংকটি ১০০% রাষ্ট্রীয় মালিকানাধীন বাণিজ্যিক ব্যাংক হিসেবে পরিচালিত হয়ে আসছে।


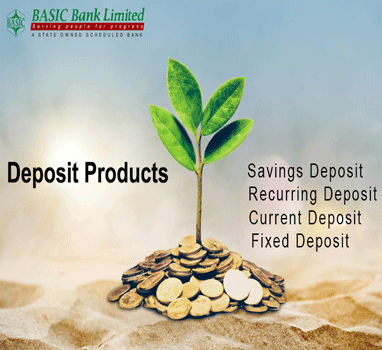
বেসিক ব্যাংক সময়মতো গ্রাহকের সঞ্চয় বাড়াতে বিভিন্ন আমানত পণ্য সরবরাহ করে। আকর্ষণীয় হারে রিটার্ন পাওয়ার জন্য কেউ নির্দিষ্ট সময়ের জন্য একক অর্থ জমা করতে পারেন।
আরও পড়ুনআপনার ব্যক্তিগত এবং ব্যবসায়িক চাহিদা অনুযায়ী আমাদের আমানত ও ঋণ পণ্য এবং ক্রেডিট কার্ড উদ্ভাবন করা হয়েছে যা আপনার নিত্য প্রয়োজনে সার্বক্ষনিক পাশে থাকবে।
বেসিক ব্যাংক মানুষের আর্থিক পণ্য এবং পরিসেবা প্রদান করে, যেমন ব্যাংক এবং সঞ্চয়ী হিসাব, বীমা এবং বন্ধকী ব্যবস্থা।
আরও পড়ুন
ক্ষুদ্র বা মাঝারি আকারের প্রতিষ্ঠানকে (এসএমই) প্রায়ই বাংলাদেশ অর্থনীতির চালিকা শক্তি হিসেবে বিবেচনা করা হয়- যা লক্ষ লক্ষ মানুষের কর্মসংস্থান করে এবং অর্থনৈতিক...
আরও পড়ুন
কর্পোরেট ব্যাংকিং সেবা প্রদানের ক্ষেত্রে ব্যাংক কর্পোরেট প্রতিষ্ঠানসমূহের নিজস্ব চাহিদা মোতাবেক অর্থায়ন ও মূলধন সংগ্রহে অগ্রাধিকার ভিত্তিক সেবা প্রদান করে...
আরও পড়ুন১২৪.০০০০
নগদ বিক্রয়১২৩.০০০০
নগদ ক্রয়১৪৬.৮১৭৬
নগদ বিক্রয়১৪০.৬৪৪২
নগদ ক্রয়১৬৯.২০২৫
নগদ বিক্রয়১৬৩.৯৫২৫
নগদ ক্রয়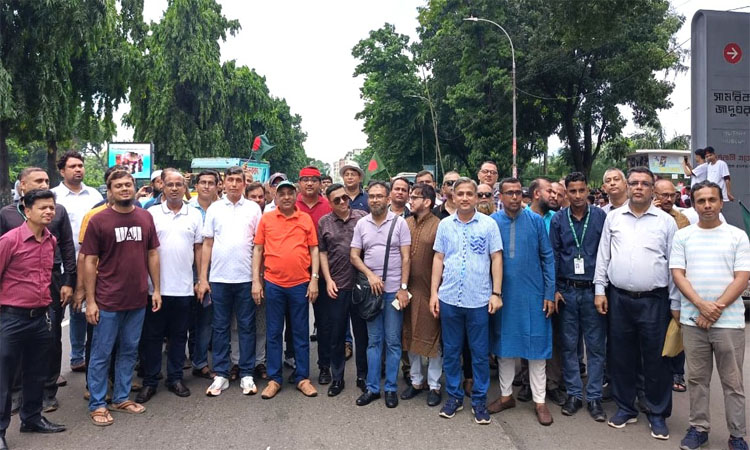
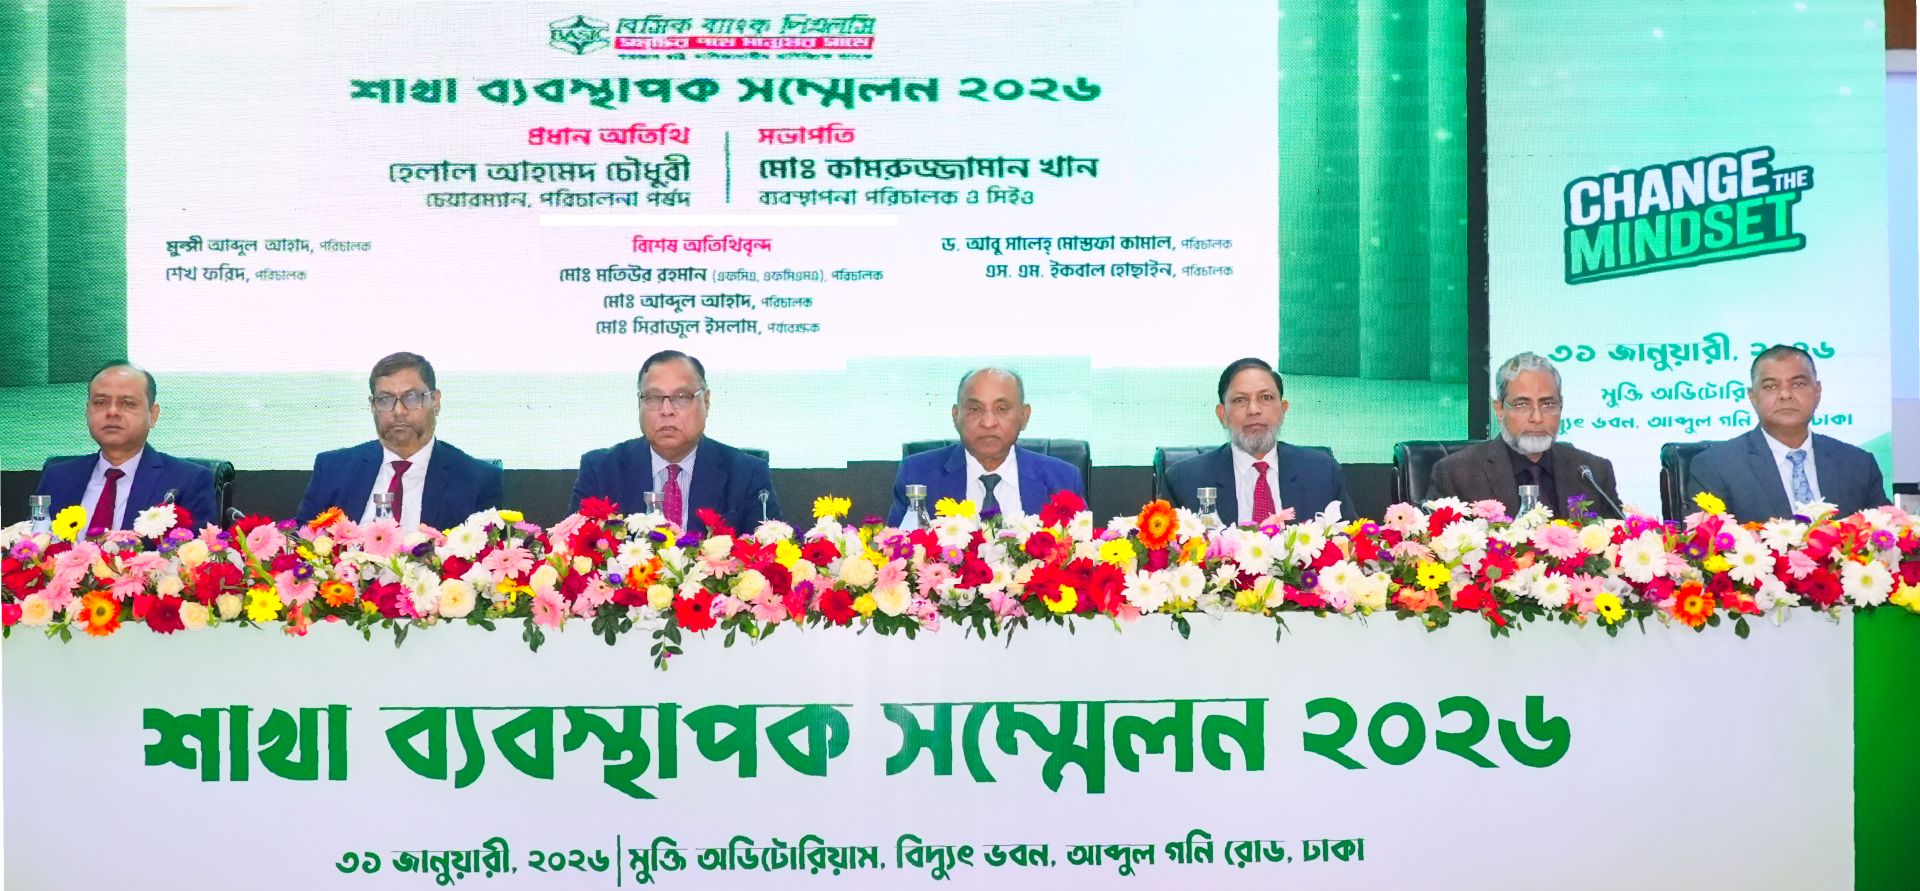
‘তারুণ্যের উৎসব ২০২৫’ উপলক্ষে মঙ্গলবার, ৫ আগস্ট ২০২৫ রাজধানীর নভোথিয়েটার থেকে বিজয় স্মরণি হয়ে মানিক মিয়া এভিনিউ পর্যন্ত আয়োজিত র্যালিতে অংশ নেয় শতভাগ রাষ্ট্র মালিকানাধীন বেসিক ব্যাংক লিমিটেড। ব্যাংকের ব্যবস্থাপনা পরিচালক ও সিইও মোঃ কামরুজ্জামান খান এর নেতৃত্বে সকল স্তরের...

রাষ্ট্রীয় মালিকানাধীন প্রতিষ্ঠান হিসেবে আমরা, বেসিক ব্যাংক পিএলসি., 'তথ্যের অধিকার'-এ দৃঢ়ভাবে বিশ্বাস করি। তাই, আগ্রহী নিলাম/দরপত্র অংশগ্রহণকারীদের এবং অন্যান্য সংশ্লিষ্ট স্টেকহোল্ডারদের জন্য আমরা আমাদের নিলাম/দরপত্র বিজ্ঞপ্তিগুলিকে প্রকাশ করি বহুল প্রচারিত জাতীয়...