| |
2014 |
2015 |
2016 |
2017 |
2018 |
| At Year End |
(Million Taka) |
| Total Loans and Advances |
89,392.85 |
128,807.01 |
134,882.80 |
145,568.59 |
151,968.05 |
| Total Investment |
30,680.55 |
|
|
|
25,313.44 |
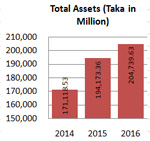
| Total Assets |
171,118.53 |
194,173.36 |
204,739.63 |
198,816.67 |
191,560.41 |
| Total Deposits |
139,934.06 |
148,167.23 |
158,070.98 |
143,180.24 |
131,821.58 |
| Long-term Debt |
2,673.97 |
2,482.94 |
2,325.16 |
2,198.15 |
7,082.11 |
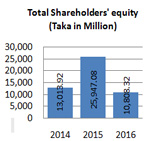
| Total Shareholder's Equity |
13,013.92 |
25,947.08 |
10,808.32 |
13,907.09 |
10,381.32 |
| Financial Ratios |
(Percentage) |
| Capital Adequacy Ratio * |
(29.08) |
(7.55) |
(15.59) |
(13.22) |
8.25 |
| Capital fund to deposit Liabilities |
9.30 |
17.51 |
6.84 |
9.71 |
7.88 |
| Liquid Assets to Total Deposit |
12.03 |
16.88 |
10.86 |
13.60 |
7.75 |
| Loan to total Deposit |
82.46 |
84.72 |
83.62 |
100.25 |
109.45 |
| Earning Assets to Total Deposit |
54.14 |
70.47 |
73.50 |
67.50 |
68.70 |
| After tax return on Average Assets |
(0.67) |
(1.72) |
(7.49) |
(3.39) |
(1.81) |
| Net Profit to Gross Income |
(7.28) |
(27.27) |
(125.12) |
(64.47) |
(36.92) |
| Interest Margin Cover |
(50.36) |
(115.46) |
(39.29) |
(6.52) |
(41.11) |
| Return on Equity (after tax) |
(11.55) |
(12.10) |
(81.24) |
(55.38) |
(21.08) |
Industrial Loans including Micro
Enterprises to Total Loans |
41.18 |
37.07 |
40.57 |
40.34 |
40.72 |
| Non performing Loans to Total Loans |
|
|
|
|
|
| Per Employee |
(Million Taka) |
| Deposit |
62.55 |
68.50 |
74.14 |
68.08 |
63.53 |
| Advance |
39.96 |
59.55 |
63.27 |
69.22 |
73.24 |
| Profit |
(0.50) |
(1.19) |
0.04 |
0.17 |
(0.58) |
| Earnings Analysis |
(Million Taka) |
| Total Income |
15,113.56 |
11,514.96 |
11,932.41 |
10,615.17 |
9,586.44 |
| Total Operating Expense |
|
|
|
|
|
| Profit before Tax |
(1,124.38) |
(2,564.25) |
90.85 |
351.55 |
(1,200.56) |
| Income Tax |
|
|
|
|
|
| Net Profit after Tax |
(1,100.16) |
(3,140.36) |
(14,930.40) |
(6,843.69) |
(3,538.95) |
|
|